In this notebook we plot some parametrized surfaces.
1. The unit sphere
We've seen in previous lectures that the sphere may be plotted as the graphs of two functions, one representing the upper half and one representing the lower half. The functions are $$ f_{\rm upper}(x,y) = f_u = \sqrt{1 - x^2 - y^2} $$ and $$ f_{\rm lower}(x,y) = f_\ell = -f_u = -\sqrt{1 - x^2 - y^2}. $$ Since the derivatives of these two functions near the equator are very large, computers have trouble graphing the portions of the sphere near the equator. You can clearly see the jagged edge numerical artifacts in the plot below.
(x,y) = var('x y');
fu = sqrt(1 - x**2 - y**2);
fl = - fu;
show(plot3d(fu,(x,-1,1),(y,-1,1),aspect_ratio = 1, viewer='tachyon') +
     plot3d(fl,(x,-1,1),(y,-1,1),aspect_ratio = 1, viewer='tachyon'))

These jagged edges may be avoided by parametrizing the unit sphere in spherical coordinates. Recall that the spherical coordinate transformation is given by $$ \begin{cases} x = \rho\sin\varphi\cos\theta, \\ y = \rho\sin\varphi\sin\theta, \\ z = \rho\cos\varphi, \end{cases}$$ where $0\leq \theta < 2\pi$ and $0 \leq \varphi \leq \pi$. For the unit sphere, $\rho = 1$, and these coordinate functions parametrize the surface of the sphere.
(ph,th) = var('ph th');
x = sin(ph)*cos(th);
y = sin(ph)*sin(th);
z = cos(ph);
parametric_plot3d([x,y,z],(ph,0,pi),(th,0,2*pi),aspect_ratio=1,viewer='tachyon')

Notice that this graph of the parametrized sphere does not suffer from the same numerical artifacts of the previous graph.
2. "Fusilli bucati" shaped pasta
In this example we wish to model the shape of the hollow pasta known as fusilli bucati.
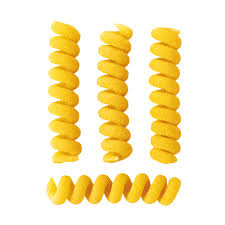
One parametrization that does the job is
$$\begin{cases} x = (2 + \sin v)\cos u, \\
y = (2 + \sin v)\sin u, \\
z = u + \cos v. \end{cases}$$
(u,v) = var('u v');
x = (2 + sin(v))*cos(u);
y = (2 + sin(v))*sin(u);
z = u + cos(v);
parametric_plot3d([x,y,z],(u,-4*pi,4*pi),(v,0,2*pi),aspect_ratio=1,
                  opacity=0.8,plot_points=1000,viewer='tachyon')

3. Surfaces of revolution
Let $y = f(x)$ be a smooth, positive function on the interval $[a,b]$. (This hypothesis may be weakened in the future.) Consider the surface in $\mathbb{R}^3$ obtained by rotating the graph of $y = f(x)$ about the $x$-axis. The points on this surface are parametrized by
$$
\begin{cases}
x = x, \\
y = f(x)\cos(\theta), \\
z = f(x)\sin(\theta),
\end{cases}
$$
where $\theta$ is the angle parallel to the $yz$-plane.
We illustrate this idea with the function $y = 2 + \sin x$ on the interval $[0,3\pi]$.
(x,th) = var('x th');
f = 2 + sin(x);
y = f*cos(th);
z = f*sin(th);
g = parametric_plot3d([x,y,z],(x,0,3*pi),(th,0,2*pi),opacity=0.8,aspect_ratio=1,viewer='tachyon');
c = parametric_plot3d([x,y(th = 7*pi/8),z(th = 7*pi/8)],(x,0,3*pi),color='red');
show(g + c)

4. The torus
The surface of revolution method in the last example may be applied to plot the graph of the torus. For the sake of consistency, let $0 < r << R$, and consider the circle centered at $(0,R)$ with radius $r$. A torus is then obtained by rotating this circle about the $x$-axis.
To plot the surface using the parametrization given in the problem above, we must break the circle into two functions.
$$
\begin{cases}
f_{\rm upper} = R + \sqrt{r^2 - x^2}, \\
f_{\rm lower} = R - \sqrt{r^2 - x^2}.
\end{cases}
$$
(u,v) = var('u v');
r = 1;
R = 5;
fu = R + sqrt(r**2 - u**2);
fl = R - sqrt(r**2 - u**2);
x = u;
y = fu*cos(v);
z = fu*sin(v);
yy = fl*cos(v);
zz = fl*sin(v);
show(parametric_plot3d([x,y,z],(u,-r,r),(v,0,2*pi),opacity=0.75,aspect_ratio=1,viewer='tachyon') +
     parametric_plot3d([x,yy,zz],(u,-r,r),(v,0,2*pi),opacity=0.9,aspect_ratio=1,viewer='tachyon') )

Here's a version of the torus parametrized by a single function.
(th,ph) = var('th ph');
r = 1;
R = 3;
x = (R + r*cos(ph))*cos(th);
y = (R + r*cos(ph))*sin(th);
z = r*sin(ph);
parametric_plot3d([x,y,z],(th,0,2*pi),(ph,0,2*pi),viewer='tachyon',aspect_ratio=1,opacity=0.8)
